Are Free Speech and App Store Ratings Related?
Here at appFigures, we are constantly exchanging theories about what drives individuals to download an app, post a rating, or write a review. One recent idea intrigued us all: Are ratings from some countries inherently more positive (or critical) than other countries?
After a bit of discussion, we decided to use app ratings to construct a sentiment index that captures each country’s overall rating disposition in relation to its peers. For those interested in the technical details, you can jump to the section on methodology at the bottom of the post. After we scrub and filter our data, we plot the index on a global map, color coordinating each country’s rating sentiment. Shades of purple indicate countries with relatively pessimistic ratings while shades of green convey relative optimism. The deeper the shade the deeper the sentiment with grey being neutral.

Most striking is the degree of clustering in the data. Western Europe and the Nordic countries stand out as tough critics when it comes to ratings. Advancing across Europe to the west, though, leads to increasingly favorable ratings. Central Europe is more neutral while countries in eastern Europe are upbeat. Outside of Europe, South East and Central Asia are uniformly positive with countries in Central America and the Andean region of South America sharing the same degree of ratings optimism.
One of the more intriguing patterns is that the advanced industrialized democracies tend to be more critical in their ratings than the rest of the world. Although the United States is the obvious exception, we can see that Japan, Canada, and Australia combine with Western and Northern Europe in forming a group of countries that tend to be more critical. Is it wealth? Is it culture? Is it technological savvy? We decided to take it a step further.
App Ratings and Free Speech
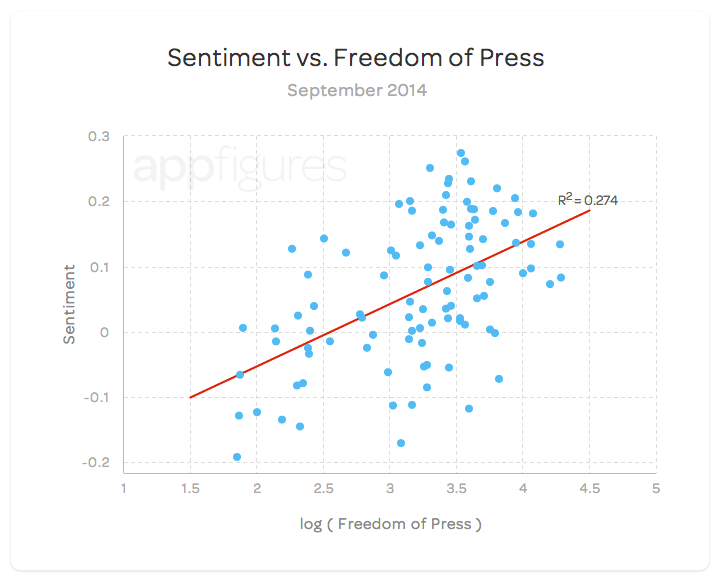
Determined to find some plausible explanation, we compare our analysis with other publicly available global indices. Some of these include GDP per capita, the UN’s Human Development Index (HDI), the World Economic Forum’s Networked Readiness Index (NRI), the World Press Freedom Index (WPFI) from Reporters Without Borders, and the Gini coefficient of income inequality. Of these indices, the World Press Freedom Index is clearly favored above the others in terms of explanatory power (followed by the Networked Readiness Index). Check out the best-fit line comparing our sentiment index with the log of the World Press Freedom Index below.

Generally speaking, countries that are less tolerant of public opinion (higher WPFI) produce app ratings that are more favorable than countries with a robust Fourth Estate. Although there is still a good deal of sentiment variation left unexplained, a relationship between country rating sentiment and freedom of the press is clearly present. There could be a variety of reasons for this relationship: Self-censorship or a firm government grip on public dissent could result in less critical ratings, even if the target is a harmless mobile app.
Takeaways
- The five most optimistic countries are:
- Qatar (0.27)
- Venezuela (0.26)
- the Dominican Republic (0.25)
- Bulgaria (0.23)
- the Ukraine (0.23).
- The five most critical countries are:
- Finland (-0.19)
- France (-0.17)
- Germany (-0.15)
- Sweden (-0.13)
- the Netherlands (-0.13)
- The U.S. is relatively neutral with a deviation value of 0.05.
- The difference between the most optimistic and the most critical country is 0.47 stars.
- For 88% of the apps included in this analysis, country designation and ratings distributions are statistically dependent. This provides support for our chosen methodology.
Methodology
Apples-to-Apples
Indices are usually complex beasts so we wanted to shed some light on how we constructed our sentiment index. We plan to continue updating this index and so methodology is very important.
One of the challenges in comparing country level ratings is settling on an appropriate metric to use. Simply averaging app ratings by country and comparing country averages was not sufficient in our initial experiments. Since there is no guarantee that each country will review the same underlying group of apps, this approach would produce apples-to-oranges comparisons. A more suitable approach is to compare and summarize how different countries review the same app, relative to each other.
To build up a global perspective, the index examines country ratings for apps worldwide. For each app, we compare how the average review for each country deviates from the overall average for that app. Averaging across a country’s individual app deviations allows us to assign a country-specific value representing its rating ‘sentiment’. Formally, for a given country i, its rating sentiment Si is given as:


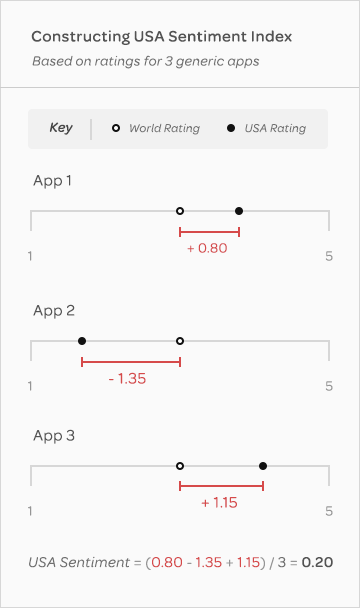
where xij is how country i rates app j, x̅j is the average country rating for app j, Ji is the set of apps country i rates, and |Ji| denotes the cardinality of that set. For a less abstract definition, take a look at the graphic to the right. Focus on the average rating from the USA for each of the three generic apps. For each app, we can record the difference between the US rating and that app’s overall average rating. For App 1, this deviation is +0.80, indicating the US rates App 1 more favorably than average. Taking the mean of each US deviation yields +0.20. In this small example, the value 0.20 represents the aggregate US sentiment when reviewing apps. In the report above, this method is extended to include a much larger number of countries and products. To ensure a valid ratings sample for both products and countries, we make three important restrictions on our data:
- We only consider country/product pairs that have a least 30 user-level ratings.
- Only products that are rated by 7 or more countries are considered.
- Countries must rate more than 30 products to be included in our analysis.
With these filters, our analysis is based on a universe of more than 220 million ratings from over 100 countries.
Significance
A natural question to ask is whether the differences between country’s rating sentiments are (statistically) significant. To address this concern, we perform two different tests. A chi-squared test is administered to each product to check whether the ratings distribution for that app (one star, two stars,…) is independent of country classification. At the standard 0.05 significance level, 88 percent of apps reject independence between country designation and ratings. Additionally, two-sample t-tests are applied to the deviation values for each unique pair of country combinations. At the 0.05 significance level, 80 percent of country combinations have statistically different sentiment values.
Variation
For those interested in the R2 value of our best-fit line, a great article from Minitab can be found here. Although a value of 0.274 may seem low, in the context of the social sciences, it is pretty solid. As an example, take a recently published report in Psychological Science that appeared in a Forbes top-ten list (#5). The R2 values from regressions in this study range from 0.30 to 0.33, all of which include a minimum of three explanatory variables.
Pingback: Free Speech and App Store Ratings: Are They Related?