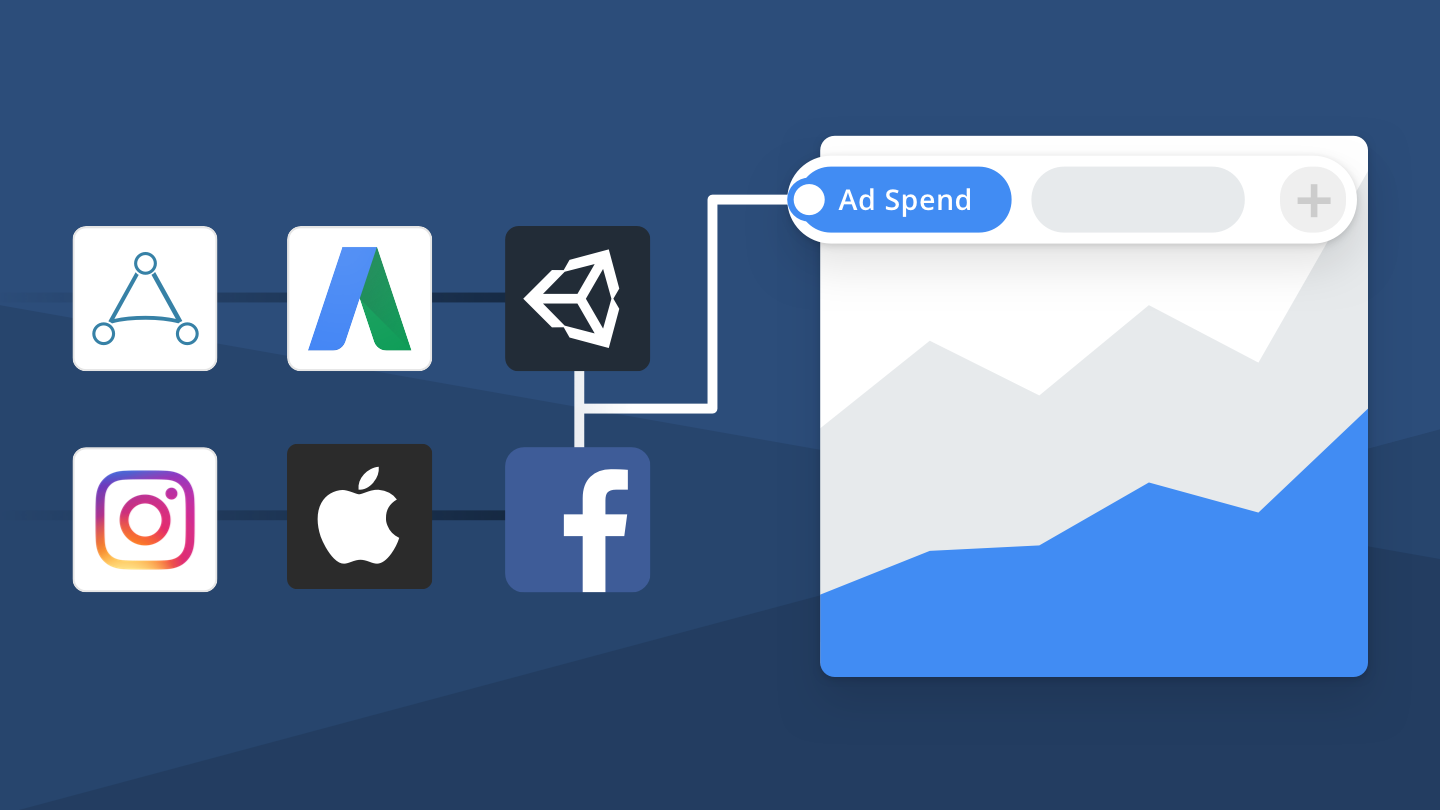
Introducing Ad Spend Analytics

You can now track your ad campaigns right alongside your downloads, revenue, ranks, ratings, and more with our new Advertiser Analytics reporting suite. Check it out →
When it comes to paid advertising, measuring results is critical to the success and cost-efficiency of any campaign. Our new ad spend reports help you keep track of the ad campaigns you’re running across different networks in one place, and easily view your spend in the context of app downloads and revenue, ranks and ratings, daily active users, and more.
Ad spend reports are available for free to all members on all plans.
API Access
All of the data the report shows on the site is also available programmatically via our API. Here’s a simple example of what the API output looks like for a single day for all campaigns across all networks.
GET https://api.appfigures.com/v2/reports/adspend?group_by=date

{
  "2018-05-08": {
    "installs": 1217,
    "clicks": 7011,
    "impressions": 206113,
    "cost": "5984.09",
    "cpc": "1.37",
    "cpa": "2.11",
    "ctr": "0.22",
    "date": "2018-05-08"
  },
  ...
}
Using the API you can also get this data by country, product, and ad network. Check out the API Documentation for more details.
Supported Networks
We’ve integrated support for the most popular ad networks, so you can track campaigns running on:
 Apple Search Ads
 Adwords
Facebook Audience
 Instagram
AppLovin
Unity
We’re also working to add support for even more ad networks, so if you’re running campaigns anywhere else please let us know.