A Deep Dive Into App Store Reviews Distribution
Reviews play a vital role in a potential consumer’s valuation of an app. Before we buy or download a product, the first thing we tend to do is read what other people say about it. This is true for any kind of product available online, and it is especially true for apps.
In this post, we take a deep dive into the U.S. App Store and explore the distribution of reviews:
- What percent of apps have reviews?
- How many reviews can the average app expect to receive?
- Which kinds of apps get the most reviews?
- Are reviews spread out evenly among different apps or do a few dominate the review boards?
To answer these questions, we’ll be using two metrics: Number of reviews per app and Concentration of reviews for iOS apps.
Let’s jump right into it.
How many Reviews can the average app expect to receive?
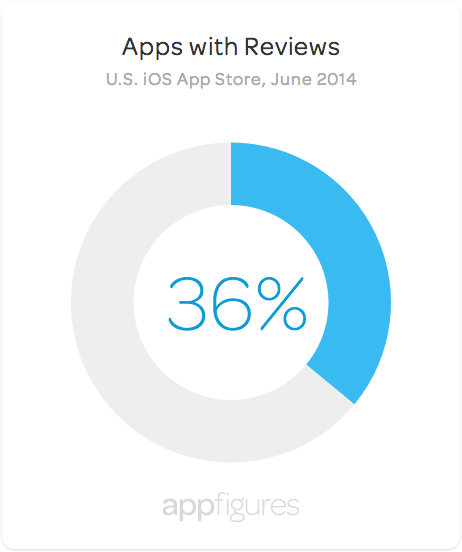
Let’s begin with the absolute basics. As of the first week in June 2014, we know that there are 1,117,990 unique iOS apps available for download in the U.S. App Store. Of these, roughly 36% have at least one review, meaning 2 out of 3 apps have not received a single review in the U.S.
In terms of the average number of reviews per app, we can break it down into three distinct views. In the chart below you can see the number of reviews per app in the entire U.S. store, the average number of reviews an app that was ranked in a “top” category at any point in its life-time receives, and average number of reviews per app for apps with at least one review.
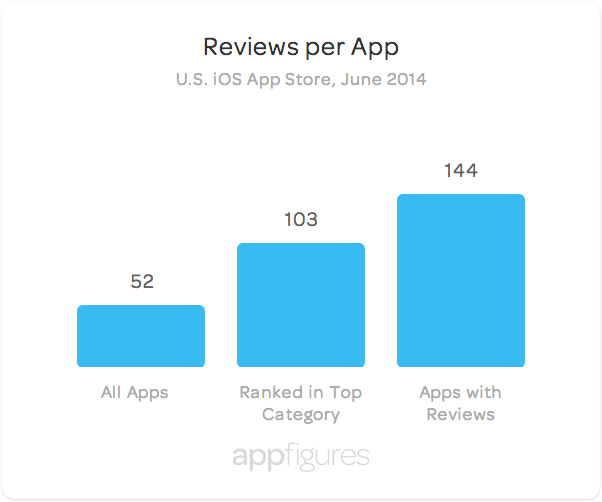
For the entire U.S. app store, there are on average 52 reviews per app. This average nearly triples to 103 when considering “top” apps, and climbs to 144 reviews per app when only considering those apps that have one or more reviews.
Which kind of apps receive the most reviews?
Digging deeper, we move away from headline figures and look at the average number of reviews for each app by category. When looking at the aggregate data, only two app categories receive greater than 150 reviews per app: Social Networking (191) and Games (162). The third and fourth ranked categories are Weather (113) and Photography (96), respectively.
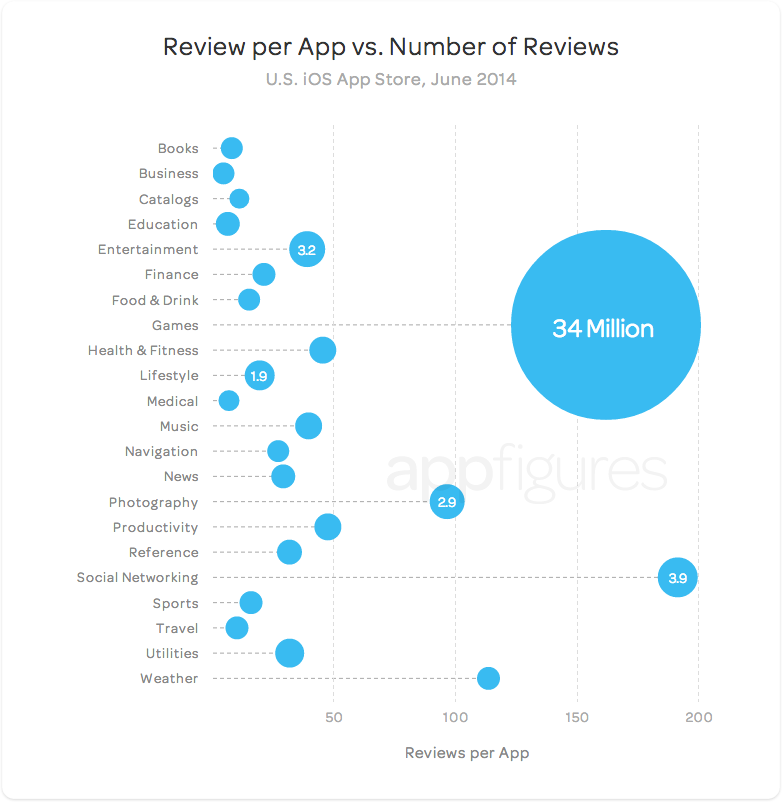
In the graph, the size of each dot is weighted by the number of reviews each category has received. The high share of reviews claimed by the Games category is striking. With Social Networking and Entertainment a distant second and third, no other category even comes close.
What about review concentration?
Here is a crucial question: Are these average review totals driven by relatively few apps with tyrannical review dominance in their respective categories? Or is there a more democratic process going on with a majority of apps in each category receiving a healthy number of reviews? To answer this question, we get creative and utilize a measure of industry concentration from the economics field. The Herfindahl index is traditionally used to measure the size of a firm in relation to the industry it belongs. We adopt this measure to assess the market concentration for reviews in each category. In this context, a high value means that a single app receives all the reviews in its category while a small value implies that reviews are divided more equally between a large number of apps.
The following bar chart summarizes the review concentration by category:
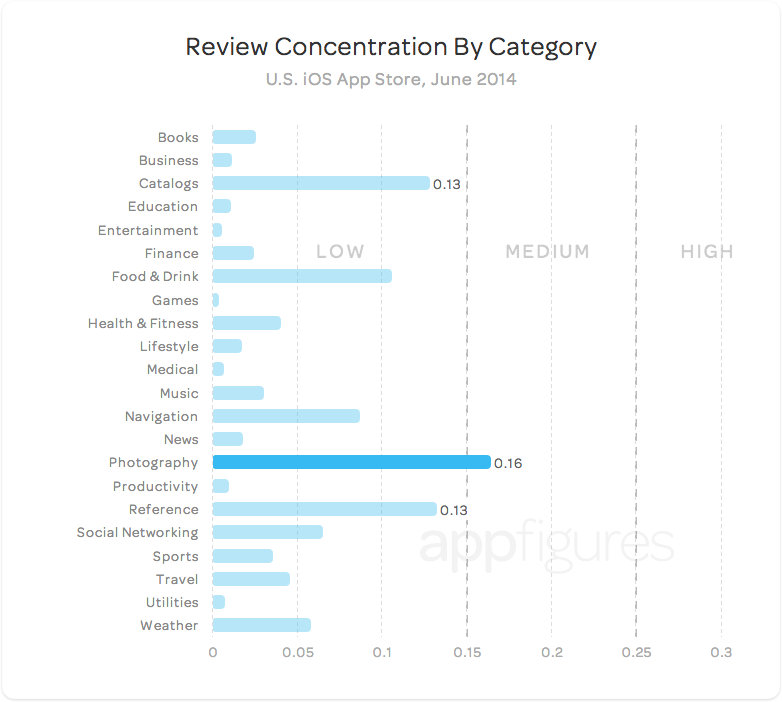
Continuing with our economic analogy, we also highlight the concentration levels of 0.15 and 0.25. These values are frequently used by the Department of Justice to classify industries as either:
- Unconcentrated markets (< 0.15)
- Moderately concentrated markets (0.15 – 0.25)
- Highly concentrated markets (> 0.25)
As we expect, the Games category — with the highest number of reviews and second highest reviews per app — is the most competitive with respect to reviews. The Education and Entertainment categories also have highly dispersed reviews. At the other end, we can see that the Photography category is designated as moderately concentrated. In this situation, a smaller group of apps in this category takes the lion’s share of reviews.
Is there a relationship between review averages and concentration levels?
To see if there is a relationship between concentration level and average number of reviews, we produce a scatterplot with concentration level on the horizontal axis and reviews per app on the vertical axis.
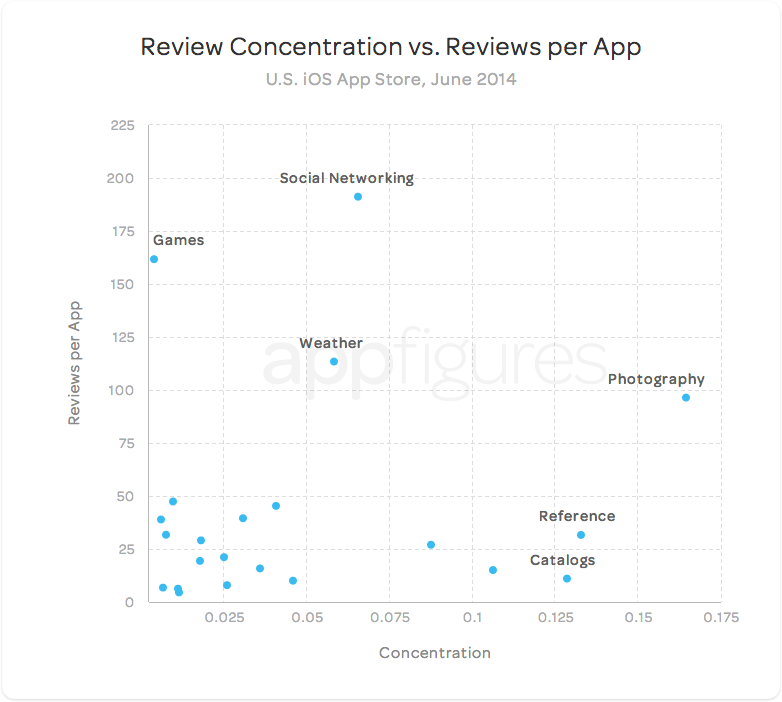
We can see that the majority of categories (18 of 22) contain less than 100 reviews per app on average and have low review concentration (< 0.15). A small group of outliers maintain a low review concentration but are extremely popular, receiving substantially more reviews per app on average (Games, Social Networking, and Weather). A second group of outliers flips this script. Catalogs, Reference, and Photography all receive a modest amount of reviews but these reviews are claimed by a small but dominant group of apps within their category.
Final Takeaways
- When considering iOS apps from the U.S. App Store, there are on average 52 reviews per app.
- Since only about one in three apps garners a review, once an app crosses the threshold and receives a comment, the number of reviews it can expect to receive jumps to 144.
- Between app categories, there is a significant variation in the concentration of reviews. On one end of the spectrum, the reviews for Education, Entertainment, and Games apps are highly dispersed between apps in those categories while reviews for Reference, Catalogs, and Photography apps are much more concentrated around a smaller group of blockbuster apps.
Important update 7/22/2014
During a re-verification of this data we discovered that we aggregated data for some apps that are no longer available for sale in the App Store (inactive), which resulted in some of the presented numbers being off. While the same conclusions are still valid, we’ve updated the entire post to reflect the correct numbers. We have also taken several steps to ensure our verification process will prevent such issues in the future.
Like this post, check out more Data Bits. Subscribe to the RSS feed or follow us on Twitter and Facebook to get new app store insights.
Pingback: Marketing Day: Facebook & Paid Search, Best Twitter Animated GIFs, MSFT Blog Outreach Backfires
You should have checked apps that are available in english, because there are tons of apps that are not made for U.S. market and don’t have any reviews in the U.S App Store.
That’s a good point. We actually looked at those numbers and they were too small to change the results. This is most likely due to a few reasons:
1. Most of the world can speak english to some extent
2. The U.S. is the largest app market
3. It usually doesn’t hurt to have an app posted in the U.S. even if it isn’t a perfect fit.
I think it’s much more interesting to understand the number of reviews as a ratio of the number of sales of an app. I’d love to see this broken down by category, and by price range.
That would certainly be nice. A good idea for a follow up ;)
This is a very interesting analysis, but leaves a lot of very interesting ground uncovered. The charts mention averages without standard deviation and/or frequency distribution, and are very vulnerable to skewed data. Controlling for length of time in the app store could also be valuable, as older apps (Facebook, Flickr, Camera+) have had more time to collect reviews and could through a simple average way off. Maybe a followup article? Either way thank you for the interesting analysis.
Thanks for the feedback Jason.
We have a few follow up article planned around reviews.
love this data. so fascinating!
Glad to hear it :)
Pingback: Appsfire Blog | A blog about App discovery, mobile marketing, and App stores.
I wonder if this is changing with the fast-growing developer review exchanges like SmoothReviews.com or appreviewme. Developers can get honest reviews form each other to get past the dreaded “0 Reviews” on the App Store, without having to violate TOS or pay for reviews.